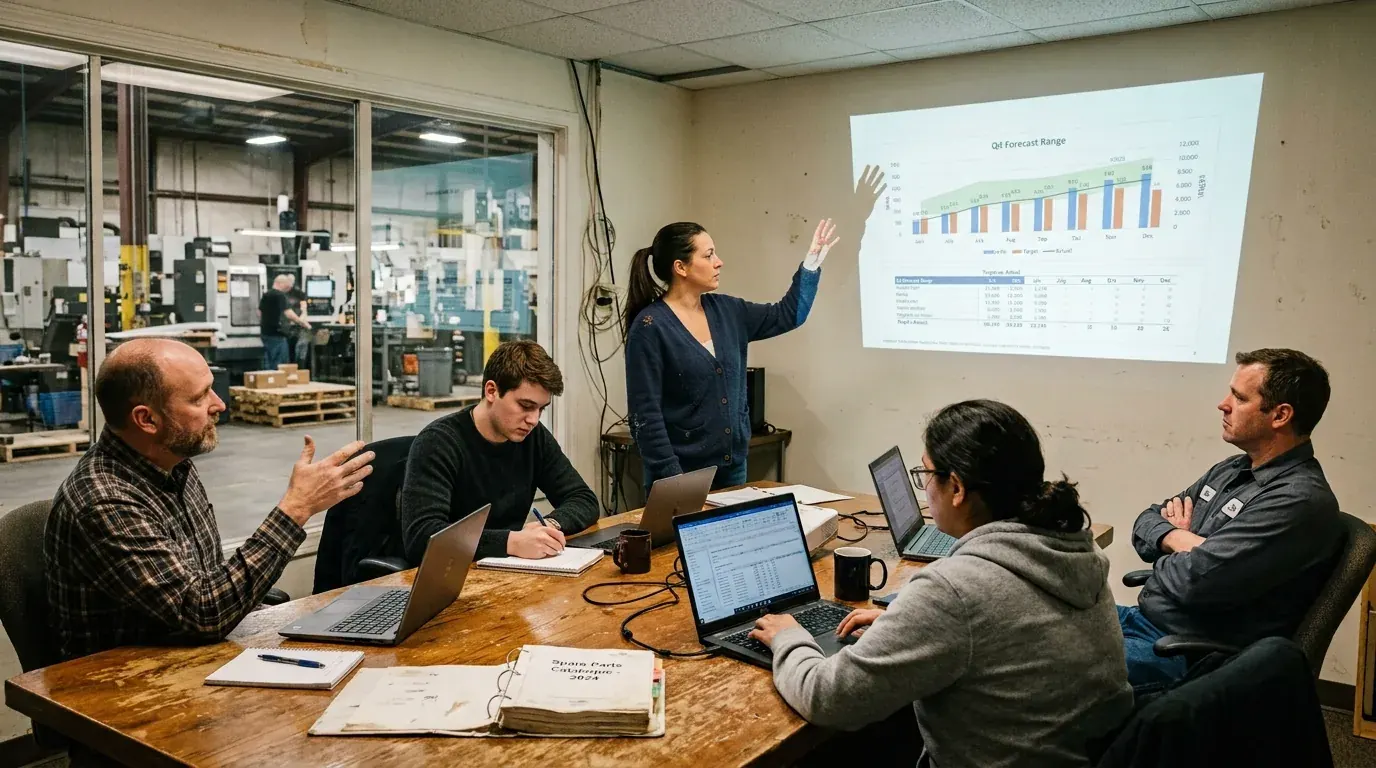
The forecast was not wrong. It could only hold one version of the future at a time, and testing a second one took a week.
Sales operations and finance4 min read
Sector, size, and function are stated. The client is not.
A range, never a point
At a glance
Sector
Industrial equipment
Function
Sales operations and finance
Sources used
CRM, ERP, invoiced revenue, production indices, FX, supplier lead times
History reconciled
Five years
Output format
Range with stated confidence, never a point
Baseline
Prior twelve months of spreadsheet forecasts, restated
The short version
Scenario runs became a standing item in the weekly meeting
They used to be a handful per quarter, because each one cost a week of somebody’s time.
Forecast accuracy improved against the spreadsheet method
Measured on the same twelve months, restated, so the comparison is like for like rather than flattering.
The argument changed shape
It moved from whose number is right to which assumption is right, which is the argument worth having.
Why scenarios, not a better number
The rolling forecast covered capital equipment, spare parts, and service. It lived in a spreadsheet that regional heads updated monthly.
Ask what happens if lead times stretch by six weeks and the honest answer was that finding out would take a week. By then the question had moved on.
AI was selected for scenario capacity, not for a better single number. Once testing a future is cheap, people start arguing about which one is most probable. That argument is the valuable part, and it was not happening because the arithmetic cost too much.
Definitions took longer than the model
This is where the project was won or lost.
Sessions with sales operations, finance, and three regional heads. The first two went entirely on definitions. The pipeline meant different things in different regions, and no one had ever said so out loud.
Five years of order data came out of CRM and ERP and was reconciled to invoiced revenue before anyone trusted it.
Project orders were separated from recurring spare parts and service. They behave nothing alike. Blending them had been hiding the signal for years.
Then the cleanup. Accounts deduplicated, currency fixed to one reporting basis, close dates backfilled where sales had left them empty. Unglamorous, and about a third of the timeline.
Drivers were agreed and tested last. Quotation volume, installed base age, industrial production indices in the main markets, exchange rates, supplier lead times. Two more were proposed and dropped because they added nothing the others did not already carry.
What was built, and what it refuses to do
After the data work, the build was straightforward.
A forecast agent, two layers and one way in.
Statistical baseline
Per-segment time series covering the recurring business.
Driver model
Covers the project business, where volume is low and a single order moves the quarter.
Scenario interface
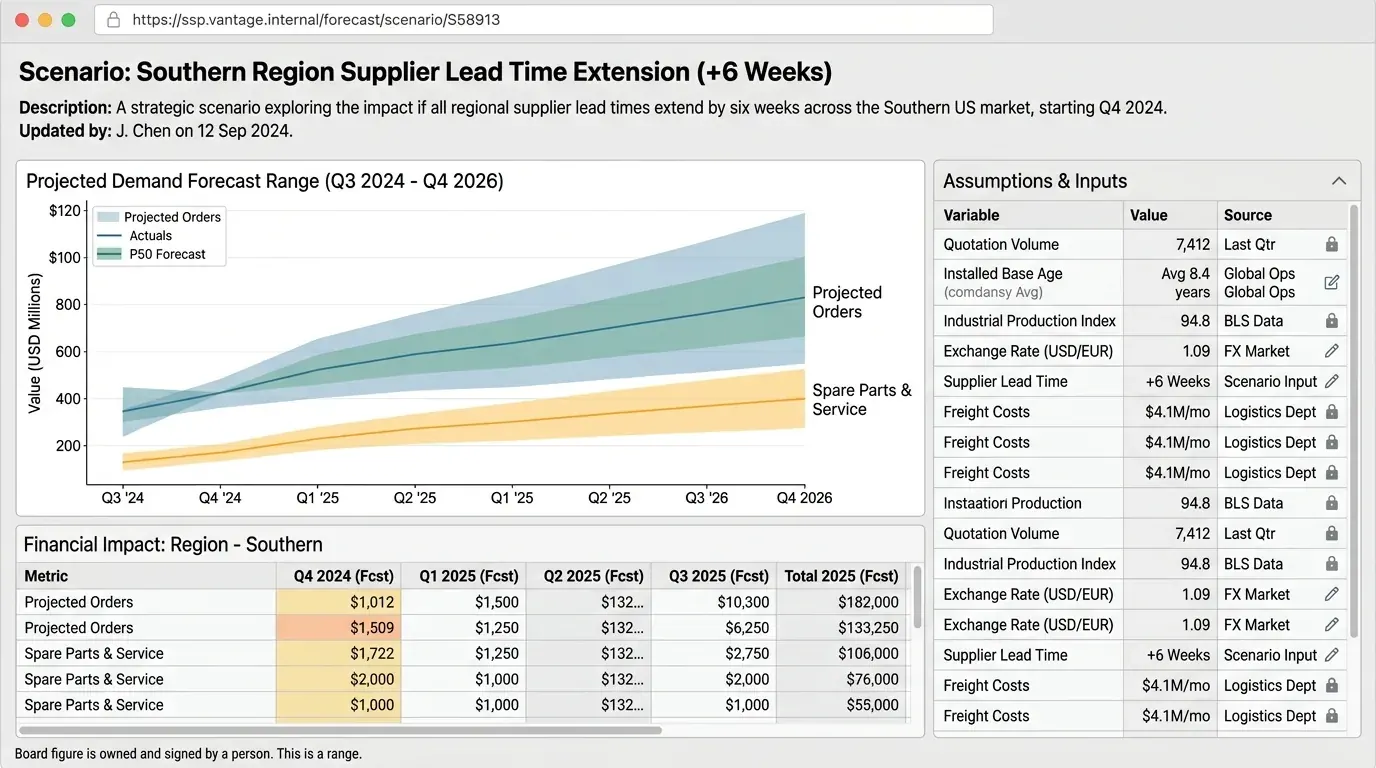
Plain language in, range out. Ask what happens if lead times extend in a region, or if a competitor’s price move takes ten percent of quotations, and the agent runs it and records the assumptions used.
A fan, not a line. The assumptions panel on the right is what makes a run reproducible next month instead of relitigated from memory.Design constraint, agreed before the build
The board figure stays owned and signed by a person. The agent produces a range and the assumptions behind it. It does not produce the number that goes to the board.
bearingbridge.ai project record, phase Bearing
Where it stands after a few months
Scenario runs went from a handful a quarter to several a week, and they are now a standing item rather than a project.
The change people noticed most was in the meetings. Arguments used to be about whose number was right. Now they are about which assumption is right, and that is the argument worth having.
Months later the agent was still in the weekly cycle. Sales operations owns it. Nobody from our side has touched it since handover.
Three things that made it work
Separating the two businesses came first
Project orders and spare parts had been averaged together for years, and the averaging destroyed the signal in both.
Ranges beat points
A single number invites false confidence and then gets defended in meetings. A range invites the conversation about assumptions.
Assumptions get logged
Every scenario is reproducible, so nobody relitigates last month’s run from memory, badly.
Figures on this page are client-verified and published with permission. Where a figure is absent, the outcome is described in operational terms instead.
A conversation with the senior team about your markets, your data, and where AI would actually pay back for you. No slides, no obligation, and if the honest answer is that AI is not your next move, you will hear that too.