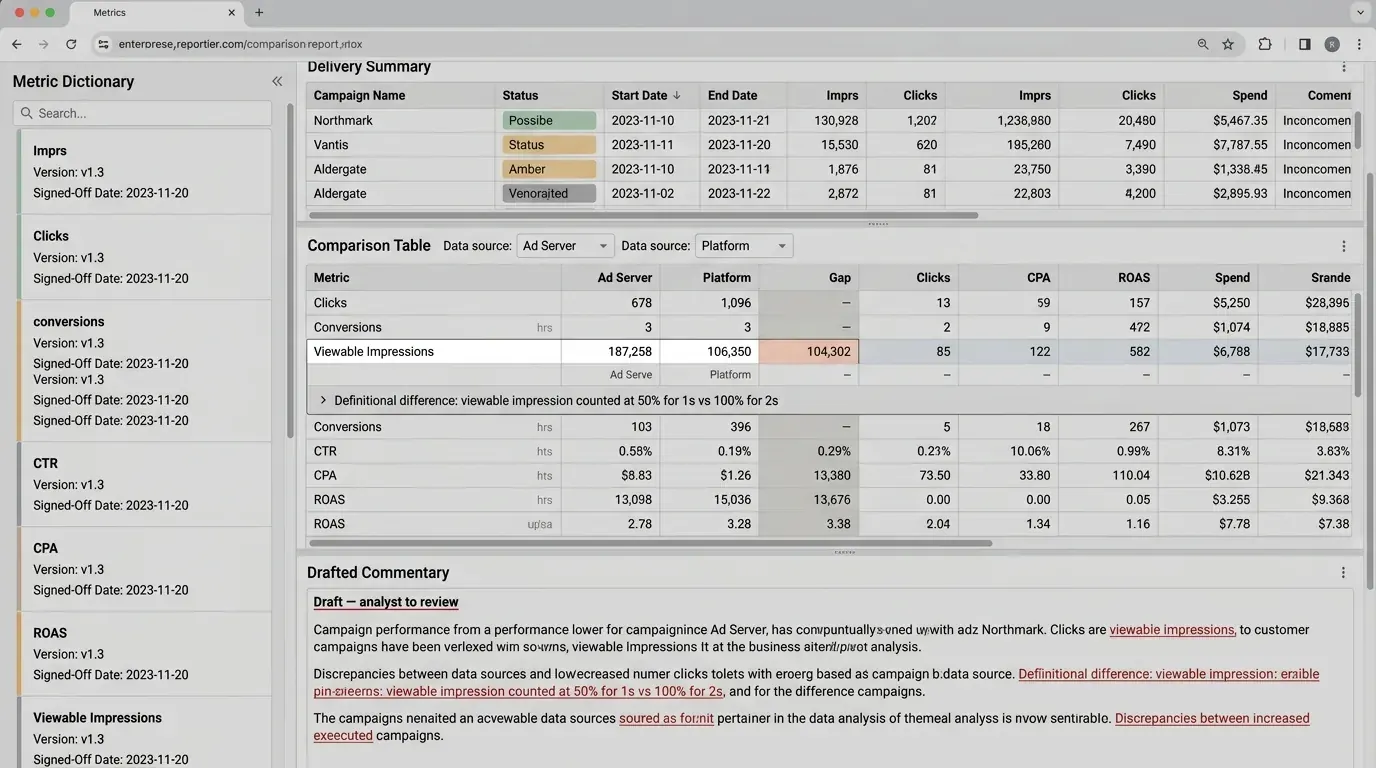
Every source counted differently. A view was not a view, and the monthly report took a week to assemble and a week to defend.
Ad operations and analytics4 min read
Sector, size, and function are stated. The client is not.
Discrepancies shown, not averaged
At a glance
Sector
Media
Function
Ad operations and analytics
Data cleaned first
Owned sites, video platforms, social channels, third-party ad servers, all with different definitions of the same word
Written and signed off
A metric dictionary
Shown, not hidden
Source discrepancies
Engagement
Dictionary work, then ingestion build
The short version
The reporting cycle went from days to hours
Delivery data arrives normalized, with the commentary already drafted from it and ready for an analyst to check.
Disputes are settled by pointing at a definition
A dated, signed definition ends the conversation. Rebuilding the report from scratch used to be the only answer available.
Analysts moved onto yield and audience work
The job they were hired for, and had not been doing because defending figures took the week.
Why defending numbers had become the job
Monthly client reporting ate the best part of a week. Clients challenged the numbers often enough that the analytics team spent more time defending figures than producing insight.
Two jobs suited automation. Normalizing messy multi-source data at a scale manual mapping could not sustain, and drafting the commentary analysts were writing by hand every month.
A signed metric dictionary came first
Everything downstream depends on this document existing.
Sessions with ad operations, editorial analytics, and the commercial team.
A metric dictionary was written and signed off, which took three attempts. That included the uncomfortable decisions. Which source is authoritative for which metric, when two of them disagree and both have a case.
Taxonomies got mapped across platforms, one at a time. Advertiser and agency hierarchies were resolved so a holding company’s spend could be seen whole.
The data job included historical reprocessing so year-on-year comparisons held, deduplication of campaign identifiers, and normalization of time zones and currencies.
Discrepancies between sources were preserved rather than averaged away. The discrepancy is often the finding.
That produced one hard conversation. The dictionary contradicted a large advertiser’s own reporting on view counts, and the media group had to go and explain why. It went better than expected, because the definition was written down and dated.
What was built, and what it refuses to hide
The interesting part is the third component.
An ingestion and normalization layer feeding a reporting agent.
Client reports
Delivery data, with commentary drafted from it and ready to send.
Ad hoc answers
The commercial team asks directly instead of filing a request with analytics.
Visible disagreement
Where sources conflict, the report shows both figures and the definitional reason for the gap.
The disagreement, on the page. Two figures, the gap between them, and the definitional reason for it, rather than one clean number nobody can defend.Design decision, and the argument against it
Showing source discrepancies rather than reconciling them was contested internally. The case against: it makes reporting look uncertain. The case for, which won: a client who finds the gap themselves stops trusting everything else. Three advertisers have since asked for the discrepancy view specifically.
bearingbridge.ai project record, phase Build
Where it stands after a few months
The reporting cycle went from days to hours.
Client disputes are now resolved by pointing at a documented definition instead of rebuilding the report from scratch.
The commercial team self-serves most of its questions. Analysts moved onto yield and audience development, and it is what the team had been hired to do and had not been doing.
Months later the dictionary had been amended several times, each amendment dated and circulated. That maintenance is the whole reason it still works.
Three things that made it work
The dictionary was signed, not circulated
An unsigned definition is just an argument waiting to happen, and it happens in front of a client.
Discrepancies stayed visible
Averaging them away would have produced clean reports and disputes nobody could win, which is the trade most media reporting quietly makes.
Historical reprocessing got done properly
Skip it and every year-on-year comparison is wrong in a way that surfaces about nine months later.
Figures on this page are client-verified and published with permission. Where a figure is absent, the outcome is described in operational terms instead.
A conversation with the senior team about your markets, your data, and where AI would actually pay back for you. No slides, no obligation, and if the honest answer is that AI is not your next move, you will hear that too.